Recently I was tasked with consuming data from websocket, analyze it and then send data to Prometheus. The theory is pretty straight forward: getting data from websocket API in a stream and analyze and take the data points and send it to prometheus for visualization. In this blog you will have all the steps and code needed to reproduce this flow. With this in mind, I decided using python to achieve all these.
Part 1. Websocket VS Rest reminder
Before we start, I would like to have a bit of revision on Websocket API and how it is different from REST API
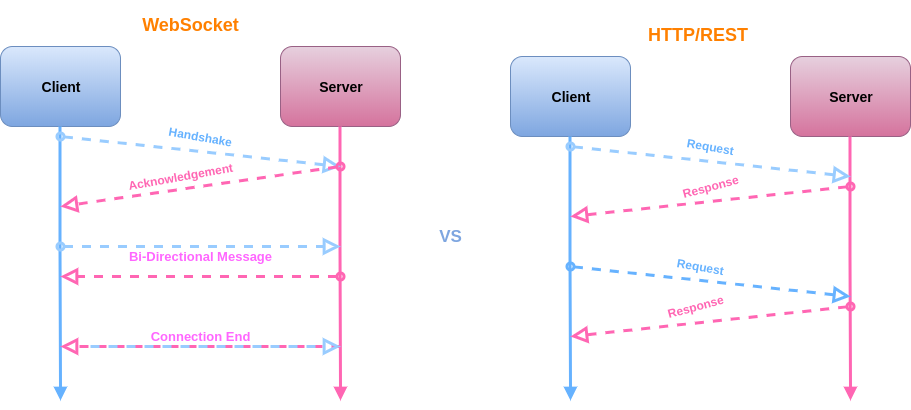
The diagram I took from internet explains it quite well. In simple term, you interact with REST API with a request and response fashion whereas in websocket there is a two way connection established during interaction lifecycle therefore you don’t need to constantly send request to server for retrieving data. At the end of the interaction, the two way connection is close.
Part 2. Consuming a websocket API
You could easily find some publicly available websocket API, the one I used for this blog is from Binance, one of the platform used by coin traders. Though myself is not doing any coin trading nor receiving any sponsorship from them. They have very detailed API documentation on their Spot API.
The following code snippet can be used to connect to websocket API:
import json
import websocket

socket = "wss://stream.binance.com:9443/ws/bnbusdt@kline_1m"

def on_open(ws):
    print("Opened connection")

def on_message(ws, message):
    data = json.loads(message)
    print(data)

def on_open(ws):
    print("Opened connection")

def on_error(ws, error):
    print(error)

ws = websocket.WebSocketApp(
    socket,
    on_open=on_open,
    on_message=on_message,
    on_error=on_error,
    on_close=on_close)

ws.run_forever()
Quick explanation
Line 4 defines the websocket url, the details of this endpoint can be found here. “/bnbusdt@kline_1m” means retrieving data from the kline stream for bnb vs usdt, what is so called a symbol, these are crypto coin terminologies which you can fine richer explanations else where.
Line 6 to line 17 defines the callback function with minimal functionality when message is received from the server. More details can be found in websocket-client official documentation.
Line 19 and 10 creates a websocket instance and start connection and run forever.
Run the above python code will give you this console output:
Opened connection
{"e": "kline", "E": 1647220248756, "s": "BNBUSDT", "k": {"t": 1647220200000, "T": 1647220259999, "s": "BNBUSDT", "i": "1m", "f": 527449288, "L": 527449503, "o": "364.60000000", "c": "364.30000000", "h": "364.60000000", "l": "364.20000000", "v": "458.54400000", "n": 216, "x": False, "q": "167076.68030000", "V": "183.99400000", "Q": "67043.53500000", "B": "0"}}
{"e": "kline", "E": 1647220251279, "s": "BNBUSDT", "k": {"t": 1647220200000, "T": 1647220259999, "s": "BNBUSDT", "i": "1m", "f": 527449288, "L": 527449507, "o": "364.60000000", "c": "364.30000000", "h": "364.60000000", "l": "364.20000000", "v": "460.67000000", "n": 220, "x": False, "q": "167851.03680000", "V": "184.66700000", "Q": "67288.70890000", "B": "0"}}
{"e": "kline", "E": 1647220253583, "s": "BNBUSDT", "k": {"t": 1647220200000, "T": 1647220259999, "s": "BNBUSDT", "i": "1m", "f": 527449288, "L": 527449513, "o": "364.60000000", "c": "364.20000000", "h": "364.60000000", "l": "364.20000000", "v": "461.78000000", "n": 226, "x": False, "q": "168255.38670000", "V": "185.54600000", "Q": "67608.92860000", "B": "0"}}
Connection closed
Futher explore the API
Previous step works fine with a single symbol, what if in the websocket I need data from more symbol or even in any websockets ?? The websocket API kindly offers subscription mode, with which you can subscribe multiple symbols and get the data back within the same websocket connection. refer to the following code for this:
import json
import websocket

socket = "wss://stream.binance.com:9443/ws"

ws = websocket.create_connection(socket)
ws.send(json.dumps({
    "method": "SUBSCRIBE",
    "params": [
        "btcusdt@kline_1m",
        "bnbusdt@kline_1m",
        "ethusdt@kline_1m",
        "dogeusdt@kline_1m",
        "xrpusdt@kline_1m"
    ],
    "id": 1
}))

def on_message(message):
    data = json.loads(message)
    print(data)

while True:
    result = ws.recv()
    on_message(result)

ws.close()
Quick explanation
Line 6-17 creates a websocket connection, the first action is to send a message to endpoint to subscribe to steams that are of interests. The payload of the subscription is like this:
{
    "method": "SUBSCRIBE",
    "params": [
        "btcusdt@kline_1m",
        "bnbusdt@kline_1m",
        "ethusdt@kline_1m",
        "dogeusdt@kline_1m",
        "xrpusdt@kline_1m"
    ],
    "id": 1
}
According to the API doc, the response of the first ws.sent(payload) call is
{
    "result": null,
    "id": 1
}
When we inspect the console output when running the above python code we also get the following which indicates we are NOT doing something crazy !
{"result": "None", "id": 1}
{"e": "kline", "E": 1647220380568, "s": "XRPUSDT", "k": {"t": 1647220320000, "T": 1647220379999, "s": "XRPUSDT", "i": "1m", "f": 429501724, "L": 429501859, "o": "0.75860000", "c": "0.75920000", "h": "0.75920000", "l": "0.75860000", "v": "81089.00000000", "n": 136, "x": true, "q": "61541.60570000", "V": "63081.00000000", "Q": "47874.45210000", "B": "0"}}
{"e": "kline", "E": 1647220382238, "s": "BTCUSDT", "k": {"t": 1647220380000, "T": 1647220439999, "s": "BTCUSDT", "i": "1m", "f": 1291349545, "L": 1291349561, "o": "38183.79000000", "c": "38183.79000000", "h": "38183.80000000", "l": "38183.79000000", "v": "0.25519000", "n": 17, "x": false, "q": "9744.12173000", "V": "0.03599000", "Q": "1374.23496200", "B": "0"}}
{"e": "kline", "E": 1647220382372, "s": "BNBUSDT", "k": {"t": 1647220380000, "T": 1647220439999, "s": "BNBUSDT", "i": "1m", "f": 527450005, "L": 527450009, "o": "363.80000000", "c": "363.70000000", "h": "363.80000000", "l": "363.70000000", "v": "2.58200000", "n": 5, "x": false, "q": "939.30620000", "V": "2.32800000", "Q": "846.92640000", "B": "0"}}
As you could see from the screenshot, the first response from the server is the acknowledgement of the subscription. The data following the acknowledgement is the data for the symbols(remember the crypto trading jargon?), and indeed we are receiving data for all the symbols we have subscribed to !
Part 3. Add prometheus-client and create metric endpoint
To start with part, first we want to add prometheus client to our code so that we could see metric being sent.
Recall the follow symbol data output from our previous step:
{
    "e": "kline",     // Event type
    "E": 123456789,   // Event time
    "s": "BNBBTC",    // Symbol
    "k": {
        "t": 123400000, // Kline start time
        "T": 123460000, // Kline close time
        "s": "BNBBTC",  // Symbol
        "i": "1m",      // Interval
        "f": 100,       // First trade ID
        "L": 200,       // Last trade ID
        "o": "0.0010",  // Open price
        "c": "0.0020",  // Close price
        "h": "0.0025",  // High price
        "l": "0.0015",  // Low price
        "v": "1000",    // Base asset volume
        "n": 100,       // Number of trades
        "x": false,     // Is this kline closed?
        "q": "1.0000",  // Quote asset volume
        "V": "500",     // Taker buy base asset volume
        "Q": "0.500",   // Taker buy quote asset volume
        "B": "123456"   // Ignore
    }
}
With reference to the doc, for our case we are interested in “l” and “h” in the “k” property for the low price and high price. Obviously we are interested in the “s” property as well for the name of the symbol. Once we understand what we need to do with our data, now it time to update the callback function accordingly to do our “analysis”. Our analysis here is as simple as just reading some properties and this is not very important here as it is on the business side in the real world, our goal in this blog is to retrieve the data and send to Prometheus and we can just send some properties as if it is our “analysis”. So let"s go
def on_message(message):
    data = json.loads(message)
    if "k" not in data:
        pass
    else:
        print(data["s"], data["k"]["l"], data["k"]["h"])
Once call back function is updated we should see the following output that captures properties we are interested
BTCUSDT 38155.15000000 38170.16000000
ETHUSDT 2534.36000000 2535.02000000
XRPUSDT 0.76010000 0.76040000
BNBUSDT 364.40000000 364.50000000
DOGEUSDT 0.11180000 0.11180000
BTCUSDT 38153.01000000 38170.16000000
Now lets start ingesting data to Prometheus using prometheus-client. Obviously we can spent our whole night trying to understand the nitty gritty of prometheus-client, but that is not the purpose right ? Our purpose here is to the things going end to end from websocket to prometheus. So let"s grab just what we need for this exercise !
import json
import websocket
from prometheus_client import Gauge, start_http_server

g = Gauge("SymbolPrice", "Symbol high and low price", ["symbols"])

start_http_server(8000)

def on_message(message):
    data = json.loads(message)
    if "k" not in data:
        pass
    else:
        print(data["s"], data["k"]["l"], data["k"]["h"])
        g.labels(f"{data["s"]}-high").set(data["k"]["h"])
        g.labels(f"{data["s"]}-low").set(data["k"]["l"])
Quick explanation
Line 5 create a Gauge object, a Gauge is a type of metrics to record a value. Like mentioned before there are other types of metrics worth exploring, sounds like a place to spend our “tech time”.
Line 6 create a Prometheus endpoint where you could see the metrics at http://localhost:8080.
When you run python code with above updates, you could start the metrics endpoint from http://localhost:8080 and see the following output. When you refresh the page you should be able to see symbol high and low price being updated! yay ! 😀
# HELP python_gc_objects_collected_total Objects collected during gc
# TYPE python_gc_objects_collected_total counter
python_gc_objects_collected_total{generation="0"} 311.0
python_gc_objects_collected_total{generation="1"} 71.0
python_gc_objects_collected_total{generation="2"} 0.0
# HELP python_gc_objects_uncollectable_total Uncollectable object found during GC
# TYPE python_gc_objects_uncollectable_total counter
python_gc_objects_uncollectable_total{generation="0"} 0.0
python_gc_objects_uncollectable_total{generation="1"} 0.0
python_gc_objects_uncollectable_total{generation="2"} 0.0
# HELP python_gc_collections_total Number of times this generation was collected
# TYPE python_gc_collections_total counter
python_gc_collections_total{generation="0"} 41.0
python_gc_collections_total{generation="1"} 3.0
python_gc_collections_total{generation="2"} 0.0
# HELP python_info Python platform information
# TYPE python_info gauge
python_info{implementation="CPython",major="3",minor="9",patchlevel="0",version="3.9.0"} 1.0
# HELP SymbolPrice Symbol high and low price
# TYPE SymbolPrice gauge
SymbolPrice{symbols="BNBUSDT-high"} 363.2
SymbolPrice{symbols="BNBUSDT-low"} 363.0
SymbolPrice{symbols="XRPUSDT-high"} 0.7599
SymbolPrice{symbols="XRPUSDT-low"} 0.7591
SymbolPrice{symbols="ETHUSDT-high"} 2525.16
SymbolPrice{symbols="ETHUSDT-low"} 2523.81
SymbolPrice{symbols="BTCUSDT-high"} 37984.81
SymbolPrice{symbols="BTCUSDT-low"} 37971.19
SymbolPrice{symbols="DOGEUSDT-high"} 0.1113
SymbolPrice{symbols="DOGEUSDT-low"} 0.1112
Part 4. Create Prometheus server and receive metrics data for visualization
In this part you will need docker installed for creating Prometheus server in container. Please refer to official documentation for setup.
Obviously you could run docker cmd for this, I have also got a docker-compose.yml here as well.
version: "3.9"
services:
  prometheus:
    image: prom/prometheus
    ports:
      - "9090:9090"
    volumes:
      - /pathofown/prometheus.yml:/etc/prometheus/prometheus.yml
Before running this you will also need a prometheus configuration file with the name of “prometheus.yml”, in a nutshell in this file you will specify the metrics endpoint from where the server is going to collect data from. When running the Prometheus container, you need to mount the volume for you Prometheus container so that this config file is place in “/etc/prometheus/prometheus.yml” at container runtime.
global:
  scrape_interval:     5s
  evaluation_interval: 5s

scrape_configs:
  - job_name: "prome-local"
    static_configs:
      - targets: ["localhost:9090"]
  - job_name: "TestJob"
    static_configs:
      - targets: ["host.docker.internal:8000"]
Quick explanation
Line 8 specifies the port of Prometheus server running locally Line 11 specifies the port and DNS name of the metric endpoint created in Part 3. Note the dns is “host.docker.internal”, this worked for me when running containers with Docker Desktop.
Lets start Docker Desktop and run Prometheus server locally either using docker cmd or docker-compose at choice of yours. When navigating to http://localhost:9090/targets,voilà !Both the Prometheus server and the Metric endpoints for the websocket are up and running !
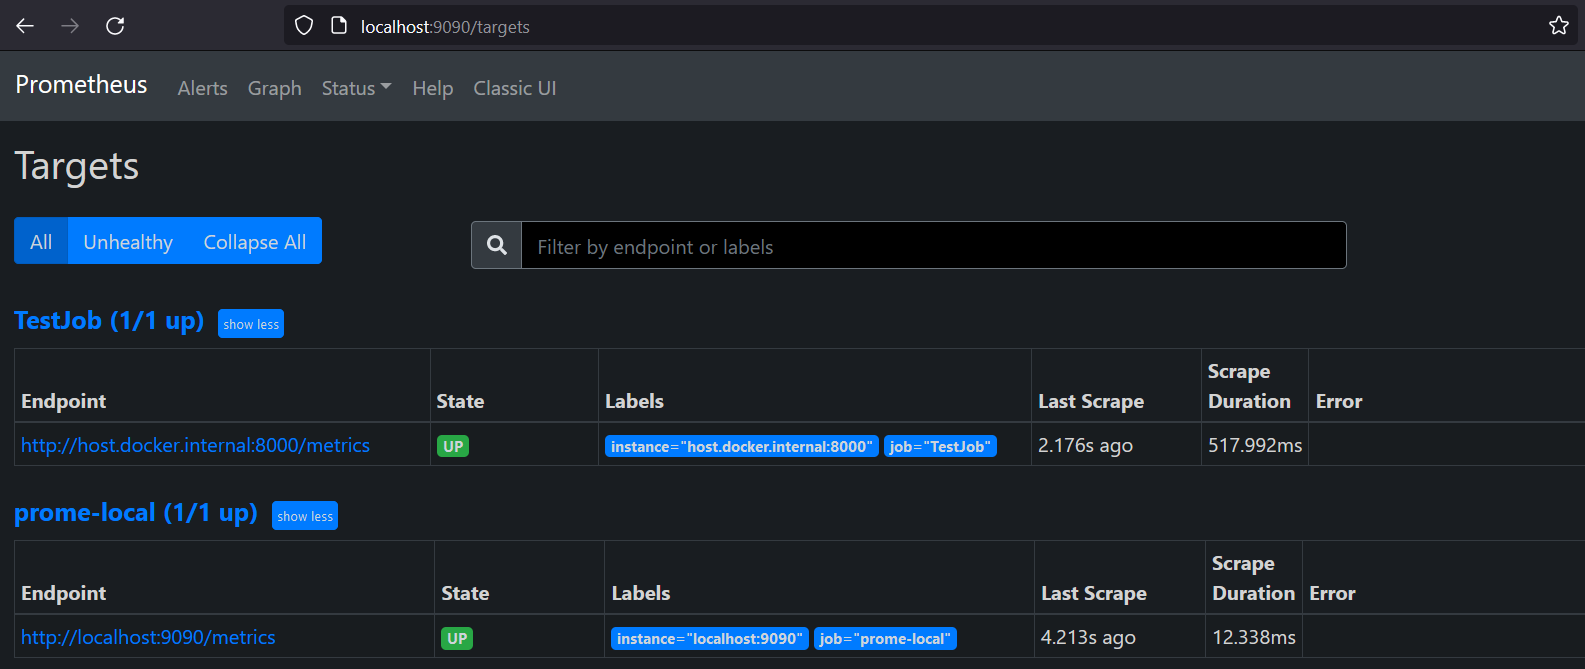
As you can see both of the jobs that you specified in the prometheus.yml file are running !
When navigate back to the graph page, you can easily enter “symbolPrice” in the search box and hit execute. You then should be able to see a graph like the following and you can highlight different labels to see the price change for each of the symbols. In may case I selected “BNBUSDT-high”
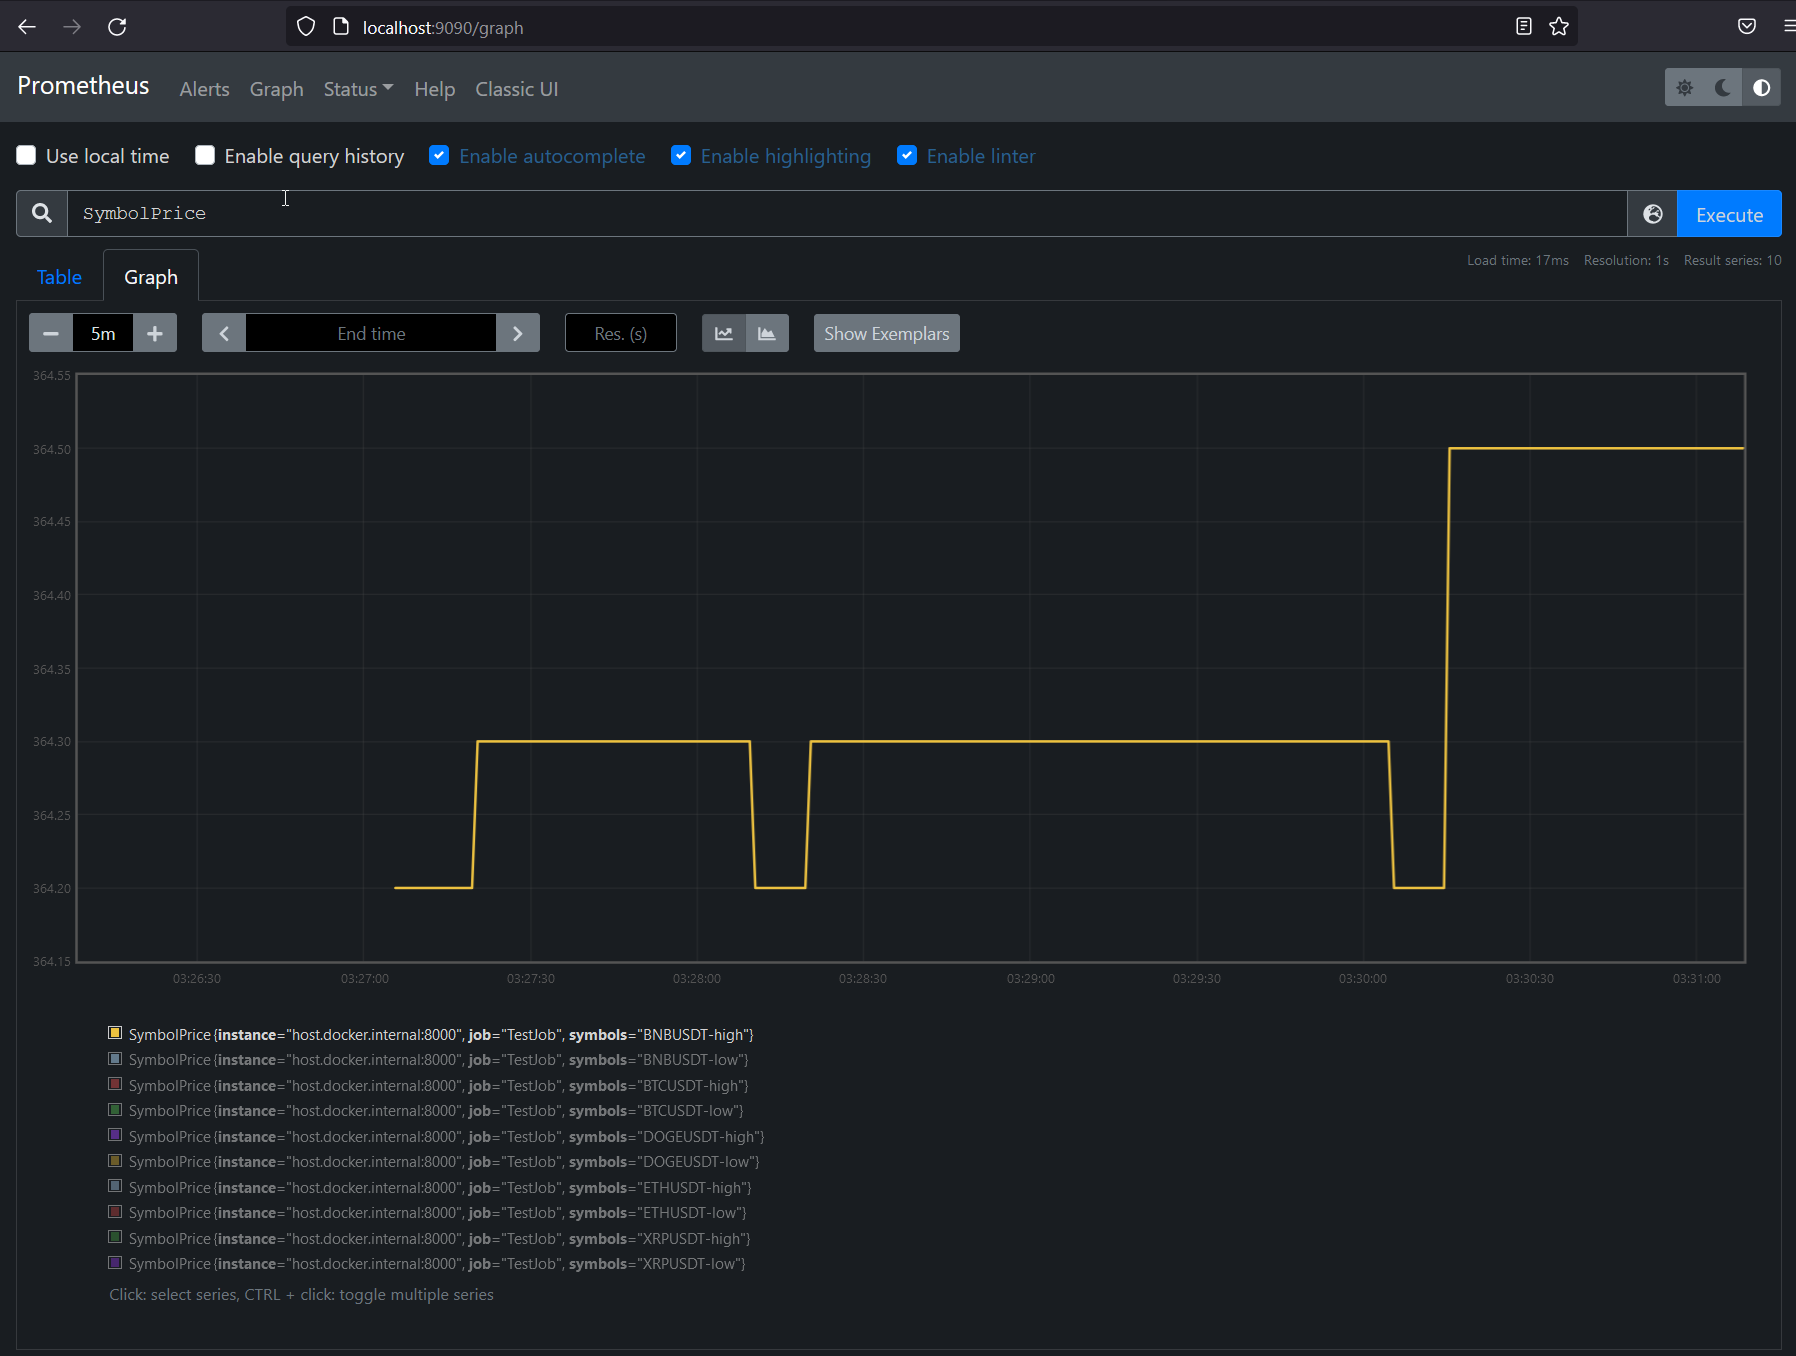
Congratulations! You"v just reach the end of this blog, I know right ? It is a rather long blog to read, but at least I found the exercise pretty interesting and when you see the graph in Prometheus, it somewhat feeling really comforting !
Thanks for you patience, see you at my next blog !!